articles on social media marketing

The Science Stories podcast – getting people to listen

It is easy to get people to click once. More difficult to get people to listen. And even harder to get people to click on that follow/subscribe button.

I am helping out with a project called Science Stories, a Danish-language podcast series that also airs on local radio. Each episode consists of an interview or talk by a scientist, and covers everything from surviving in outer space, to the cardiac capacities of horses. It is fascinating, informative, well-produced by accomplished Danish journalists, and now has more than 50 episodes that you can scroll through and see here.

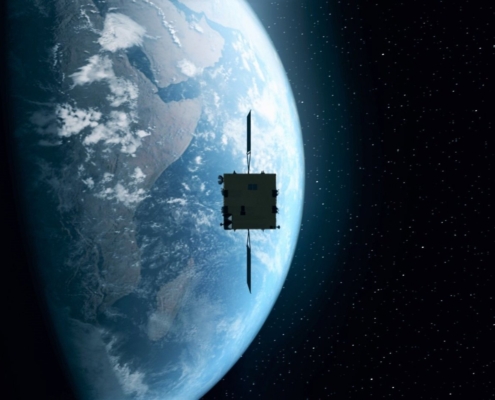
Artist’s impression from the video ‘Hera: ESA’s Planetary Defence Mission’ (credit; ESA) and illustration to the podcast episode on Space Safety called ‘It’s only a question of time before the Earth is hit’.

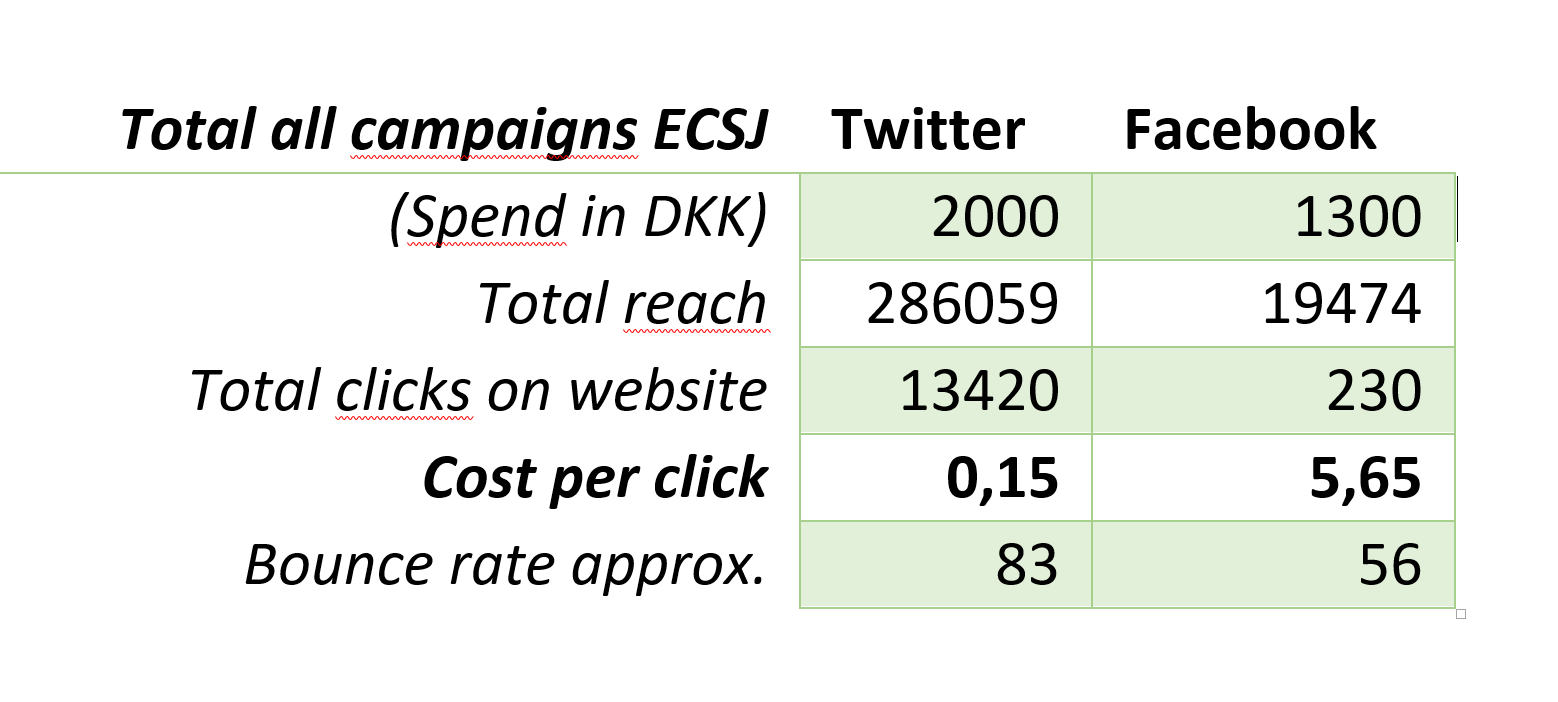
It started up in May last year, and my job is to get the Science Stories podcasts in front of a bigger audience. So far, this has been by working out a social media and distribution strategy, doing a social media workshop for the science journalists, and by organising the different Science Stories’ social media streams, primarily Facebook and Twitter. I have had a small budget for social media advertising.

As a journalist and editor, I know a lot about getting people to click and read. What I did not know much about before I started working on this project was how to get people to click and listen. How do you get other people to click and play or, even better, to click and subscribe to your shows and playlists?

The strategy

At Science Stories, we hope to gain a large and loyal group of listeners. The point of our social media activity is not to lure people into clicking onto a webpage; it is to get curious listeners to voluntarily opt into subscribing and following our podcasts so that they listen to us again, and again. This can be a challenge when most people understandably prefer to avoid clicking on anything – or if they do click, to click in and bounce out, never to come back again.

This has implications for what we post. Given that this is our long-term goal, social media posts always have the purpose of getting followers and subscribers on the podcast platforms where Sound Stories is hosted and played, rather than, say, one-off traffic to our website ScienceStories.dk. When a listener ‘follows’ or ‘subscribes’ to us on a hosted podcast provider like Apple Podcasts (for iPhones), Spotify, or SoundCloud, we are on their phones, available, when they open their podcasts on their daily commute. Listeners can also see new podcasts when they are released, and will often shop around in our backlog of podcasts, depending on the listeners’ interests. This traffic to our older backlog, and returning traffic from our followers, will, we hope, make up a larger and larger portion of our play statistics in the longer term.

How has it gone so far?

Below is a graph showing the development in traffic measured in ‘plays’ of Science Stories’ podcasts in 2019. The traffic is only podcast traffic and does not include listening numbers via our local radio partner. A total of 49 programmes were released between the launch in April 2019 and the end of the year. Science Stories achieved 11,321 plays.

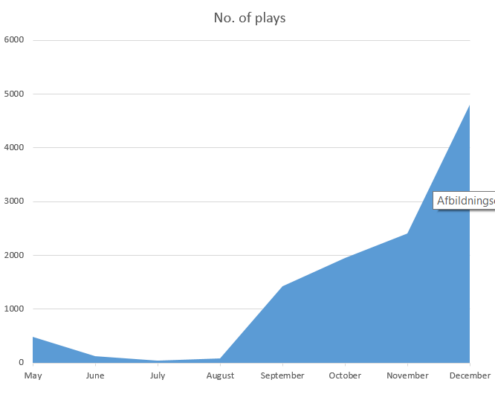
Plays of Science Stories’ podcasts in the period April to December 2019. The graph is based on numbers from the statistics shown on our podcast-host SoundCloud.

The graph looks exponential. And traffic has continued this growth path, through year-end, to the time of writing (January 2020). At some point the graph will drop off and become linear, I expect, as new subscribers cannot be expected to listen to all new programmes, and there is a limit to the number of interested people who can listen.

Here below is one of Science Stories’ podcasts, an English-language interview with Nobel Prize winner Michael Rosbash. You can click and listen:

Our social media posts have mostly been intended to make our followers/subscribers aware of new podcast releases (49 of them in 2019), and to achieve the (difficult) recruitment of new followers and subscribers, preferably directly on their podcast players like Spotify and Apple Podcasts.

After an initial slow pick-up of subscribers and followers, these numbers are now going up, and Science Stories is now gaining a good proportion of its total play traffic from listeners who have chosen to follow/subscribe to us on the main podcast players.

It looks good, but the exponential increase in the number of plays is actually no big surprise to me. Especially for a podcast that’s uploading good, new content at a constant rate, and where older episodes are also gaining new traffic with every new subscriber and follower. Remember, each time a new visitor arrives on the site, or subscribes to a feed, they now have a whole backlog of podcasts that they can listen to. This means that later subscribers, and later website visitors have a higher incentive to listen to a lot of podcast episodes.

I hope we can keep it up!

What we do on each platform

One of the fortunate side effects of our social media activity has been increasing follower numbers on Facebook and Twitter. Our numbers here have been growing, no big revelations here, with 671 following us on Facebook and 531 following us on Twitter at the time of writing.

Our Twitter and Facebook tactics are different, but they both play into the overall strategy of aiming for returning listeners rather than one-off clicks.

If you see this logo, please follow!

We post on both platforms in Danish to a Danish-speaking audience.

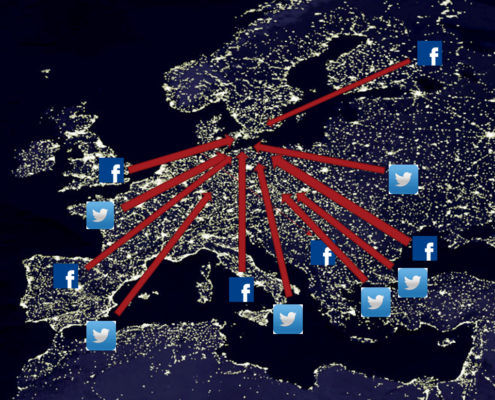
In Denmark, Twitter is the preferred platform for scientists, professionals, policymakers, and interest groups. As a platform, it is ideal for making scientists who work in the same field as a specific podcast episode aware of it. For promoted (paid) posts, its algorithms also allow us to target audiences with specific interests like, say, astronomy for podcasts on space. We tag the scientists in our posts to make them aware of programmes that touch on their specific expertise, allowing them to retweet to their followers, who, of course, are already interested in their field.

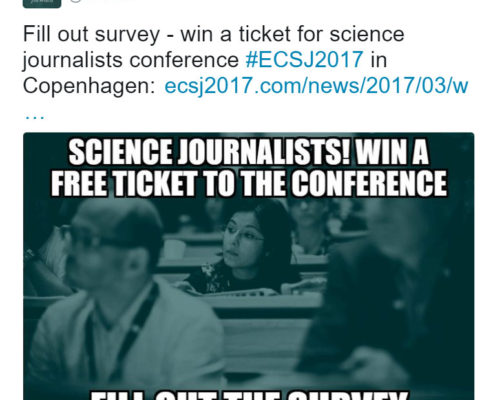
On Twitter posts (tweets), our programmes can actually be directly embedded. Listeners can start a programme with one click (see image below). This, in effect, turns Twitter into a hosting platform in and of itself, so that our Twitter followers are, for all intents and purposes, a ‘subscriber’ to our feed. Scrolling down our Twitter profile is an easy way for potential listeners to get an overview of what programmes we have to offer.

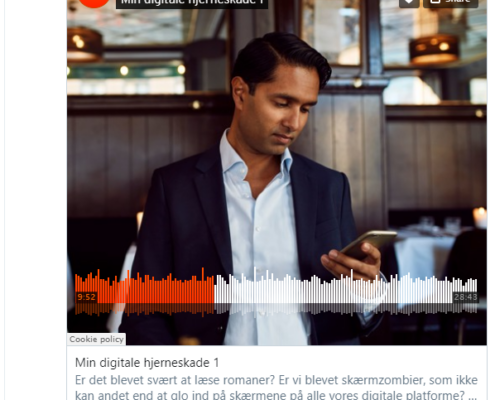
When podcasts can be embedded directly on a platform, the platform becomes the host. Scrolling down can be the best way to see the offering of episodes.

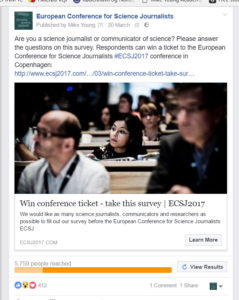
Facebook is shunned by the elites, and by the young. But it is still the most popular social media platform in Denmark. And it still gets science-interested people to click on the headline, go to the page on a website … and listen. Without regular boosts (advertising of specific posts), the circle of followers on Facebook remains relatively static and localized. For this reason, we have made targeted boosts of the posts that have already proven to perform well organically.

We are also present on LinkedIn, so far without spending a lot of time and energy there, but you are welcome to follow us if you want!

We plan to have a larger presence on YouTube in 2020. Right now, there is a nice set of shorter videos with kitchen science.

More than 70 per cent of traffic to the ScienceStories.dk website comes directly from social media (people clicking on a link that is posted on Facebook or Twitter).

Science Stories organizes a series of small-scale public events called ‘Videnskabssaloner’ or science salons, which are wonderful ways to get out and meet sciencey people if you are in the Copenhagen area. Some of these events can also be seen on our YouTube channel.

Is it working?

I think so.

The idea is to support the growth in the number of plays by convincing listeners to subscribe and follow us on podcast players, rather than to get visits to our own website. The strategy is starting to pay off: A large proportion of our traffic to new programmes now already comes from returning listeners.

So things are going well.

During the course of the Science Stories project, I got valuable advice from marketers like ‘Maggie’ Jane Magaard, and podcasters like Camilla Lærke Lærkesen and Mark Khurana. Thanks guys!

If you understand Danish I recommend you try out one of the podcasts on our list here. Follow us on:

☞ Facebook
Twitter
Apple/iTunes
Spotify
RSS

If you are interested in any of my communication services, you can get an overview here.

Which is best: Twitter or Facebook for promoting events?

Twitter or Facebook? The two platforms were tested on a campaign for the European Conference for Science Journalists. There was a clear winner

For most people in a non-professional capacity, posts on Facebook and Twitter are for free. But many businesses and organisations opt to pay the social media platforms to boost their content and posts so they reach a wider audience.

Twitter or Facebook

Campaign tested on both Facebook and Twitter

If you need to attract followers fast, make people aware of a specific event, or advertise, then promoting or boosting content can be a smart thing to do.

But which is best? Twitter or Facebook?

I got the opportunity to test this in connection with the European Conference for Science Journalists which took place in Copenhagen 26th-30th June 2017. Mike Young Academy took care of the outreach and social media for the conference.

One of my tasks was to make journalists in Europe aware of the conference. With a small budget for advertising I was therefore able to boost the same underlying content, promoting the conference on both Twitter and Facebook.

This allowed me to test, for a limited and clearly defined goal, the relative merits of the two social media platforms: I was able to see how many people clicked on to the underlying conference website ECSJ2017.com from each platform for each boosted campaign. And I could use web data measured via Google Analytics to estimate (via proxies like bounce rate etc.) the likelihood of the intended audience ultimately coming to the conference.

Three-step process

Finding out which platform performs the best is a three-step process, where I first compare the reach, then the engagement, then the quality of the traffic coming from each platform.

First the reach, or the number of people who see the content on their Twitter and Facebook news feeds:

I take the same underlying content, three different webpages on ECSJ2017.com (a survey, a travel grant and a registration deadline) and post it on Twitter and Facebook. I then use the same amount of money to boost or promote the content on each platform, trying to maximize the reach of the content, and targeting as specific as I can to science journalists in Europe.

Second step is comparing the engagement, or the number of clicks that each boost/promotion resulted in on the ECSJ2017.com website. I can measure this using Google Analytics.

Third step is estimating the quality of the engaged traffic, or the relative number of people who register for the conference as a result of clicking on the boost/promotion. For this I use a number of measures, but mostly rely on bounce rate. More on this later.

I can then evaluate which platform performs the best.

Reach – getting it out on to people’s feeds

Here below is an example of one of the posts I boosted on the ECJ2017 Twitter account.

Twitter or Facebook

Tweet about a survey for #ECSJ2017 that was given a paid promotion.

I am trying to target the posts as specific as possible on science journalists in Europe.

Twitter offers a wide range of targeting options. I delimit the campaign to European countries and type in keywords like ‘science communication’ and ‘science journalism’. The idea is that Twitter matches your promotion with users’ profiles (and possibly the content of their tweets, Twitter does not say so).

Another interesting function is being able to match your promotion to people that you know on Twitter already. So I match the campaign to a few Twitter journalist profiles that already follow our profile and that have a good science journalism following already. The Twitter algorithm should then show my promotion to other profiles like them.

Balkans here we come

And it works!

Minutes after pressing ‘go’ on the promotion, the campaign is approved on Twitter and the traffic starts pouring in on the ECSJ2017 page, as can be seen on Google Analytics from all of the countries in Europe.

The targeting choices on Facebook are oriented towards consumer choices and lifestyle rather than interests.

After a couple of hours, I realized that we were mostly getting traffic from Southeastern Europe. This is fine, but I wanted to spread it out a bit, so I went in and edited out these countries from the promotion. The traffic then shifted to the rest of Europe.

What is happening here? My theory is that with the bidding system that Twitter uses, my tweet  is showing predominantly to Southeastern European locations as it can show them at a lower price.

But with the adjustments, it worked again throughout Europe. 66,000 impressions and nearly 2,900 clicks within a few days, according to Twitter’s own system. This squares roughly with the traffic that I can verify on Google Analytics. I paid around DKK 0.2 per click or EUR 0.03 per click.

Now to Facebook. The Facebook post is below.

Twitter or Facebook

Post as used for the Facebook campaign for #ECSJ2017

The Facebook campaign has a harder time finding and targeting science journalists. The targeting choices on Facebook are oriented towards consumer choices and lifestyle rather than interests. But I set it up as good as I can, and pressed ‘go’. Strangely, and like Twitter, Facebook had a propensity to show my promoted content to Southeastern Europe.

The campaign garnered hundreds of likes, and even a few ‘heart’ emoticons. But few clicks. No matter what I tried, it appeared as if I ended up paying for ‘likes’ rather than clicks on to the webpage.

In the end it garnered 20 link clicks and more than a hundred page likes, and had me paying upwards of DKK 16 or EUR 2 per click, which seemed expensive.

Getting people to do stuff – engagement

“Are you a science journalist? Grants of up to EUR 600 for travel and accommodation in #ECSJ2017 in Copenhagen.”

This was the content of my second campaign, and by now I was learning the tricks.

Target the next Twitter campaign on countries, on keywords in profiles, and on users like the ones that follow you already. And be careful of the algorithm’s propensity to over-expose to Southeastern Europe.

It resulted in 76,000 impressions, got 3,400 clicks, at an average cost of DKK 0,20 or EUR 0,03 per click.

Facebook on the other hand, was still sluggish.

Facebook has a targeting function called ‘friends of friends’, and so I applied this. This means that the promoted post will be shown to anyone who is a friend of someone who already likes your page. The logic is, that if someone likes your page – say, a science journalist – then their friends are more likely to be science journalists.

To increase the pressure I subsequently promoted the same post using the so-called website tags function.

It was so much harder to reach people through Facebook, that the people we actually did reach were more likely to be interested in our conference.

Facebook, and Twitter, introduced website tags a few years ago. What it means is that you add a snippet of code to your website. Facebook and Twitter then target users in your promotions to people who are like the people who have visited your site already.

With this, more targeted, approach, Facebook started performing better. It reached more than 5,000 people, and got me 67 link clicks for a DKK 300 promotion, or around DKK 4.5 (EUR 0.6) per click.

But still, Twitter appears to be blasting away from Facebook.

Only people who are really interested, matter

Here is a table showing an aggregate of the promoted posts with their reach or number of impressions, the number of clicks generated for each platform, the costs per click, and the bounce rate (more about bounce rate below).

Facebook vs. Twitter

Facebook vs Twitter for selected ECSJ campaigns

So we now know that Twitter is outperforming Facebook considerably. But what about the quality of the traffic generated? Is there more likelihood that the people coming through to your website from Facebook actually do something on your website, like register to the conference?

This is a hard question to answer, and could only be definitively answered if we had website tags set up throughout the conference registration process, so that I could follow users from Twitter/Facebook on to the ECSJ2017 site, then on to the separate registration site, and then exiting with a confirmed registration. This was not possible for us.

Difficult to verify

But there are other ways to measure the quality of incoming traffic. The ‘bounce rate’ is the percentage of people that enter your webpage and then exit without clicking on to another page on your site. The bounce rate can be used as a proxy for quality: People who are genuinely interested, and who come to your web page through a promotion will want to find out more by clicking on to other pages on your site. People who are not interested, or who have entered your web page by mistake, will leave right away.

The bounce rate for all the traffic coming in through our Twitter campaigns was in the range of 80 per cent. That means that 80 per cent of all the users who entered the page left again without clicking further on the site. Facebook did better here.  The low traffic numbers on Facebook meant that there is room for statistical error, but Facebook traffic had bounce rates ranging from 39-60 per cent.

On balance, the quality of the Facebook campaign traffic that I did get was better. My interpretation is that it was so much harder to reach people through Facebook, that the people we actually did reach were more likely to be interested in our conference.

By now you will realise which platform has won this contest overall though. Twitter outreached and then out-clicked Facebook by factors of up to 100. Even if you correct for a lower bounce rate on Facebook showing higher quality, Twitter gave us far more value for money.

On top of this, the promotion process on Facebook is complicated: It is hard to work out exactly how many paid clicks you have received for each paid promotion, and it can take ages (in one case, 22 hours) to get your promotion approved by the Facebook moderators.

Pears and bananas

Now the disclaimers. Comparing Facebook and Twitter is, of course, like comparing pears and bananas.

First, Twitter and Facebook work differently and it is impossible to target users on the platforms in the same way. But my contention is, that if I maxed out on my own attempt to target the audience on each platform, to the best of my ability, I would at least prove something.

Second, the likelihood that Twitter will win this contest is greatly increased by the fact that Twitter is the social media of choice for journalists.

So look at this as a case study in the promotion of content up to a conference event.

The data may, or may not, have relevance for other fields. But even I was surprised to see the numbers!

Should I have promoted the content differently on each platform? Are there better ways to measure the quality of the traffic? Have I made a big mistake? Please let me know! I am interested to hear any comments you may have!

Be a social media influencer! Here is my Twitter course for communicators, researchers and experts. See Mike Young Academy services here.